The Decision Value of Price and Macro Information
Overview
This study asks whether macroeconomic information adds portfolio decision value beyond information already contained in market prices. The comparison is built around a matched multi-asset forecasting, ranking, and Top-4 allocation process rather than comparing unrelated strategies.
Historical-vintage FRED-MD data are used to evaluate macro information under a documented information clock. The paper then measures the incremental contribution of Macro+Price relative to a price-only process, with benchmark-relative evidence and robustness checks designed to separate predictive inputs from portfolio mechanics.
Research Question
Key Findings
Selected Evidence
The central empirical distinction is between value already present in price-based decisions and the incremental value obtained after macro information is added to the same decision architecture.
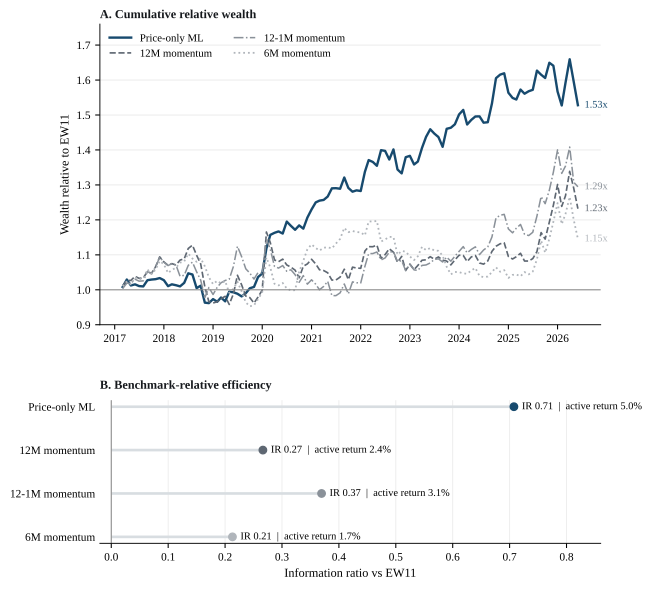
Primary one-month-ahead results relative to the same-universe EW11 benchmark.
| Strategy | Active return | TE | IR | Sharpe | Max drawdown | Turnover |
|---|---|---|---|---|---|---|
| Price-only ML | 5.0% | 7.1% | 0.71 | 0.821 | −17.7% | 3.06 |
| 12M momentum | 2.4% | 9.1% | 0.27 | 0.750 | −18.4% | 2.18 |
| 12-1M momentum | 3.1% | 8.3% | 0.37 | 0.750 | −19.1% | 2.22 |
| 6M momentum | 1.7% | 7.9% | 0.21 | 0.676 | −22.5% | 2.81 |
| Macro+Price ML | 5.4% | 7.9% | 0.69 | 0.798 | −25.6% | 3.07 |
| Macro-only ML | 2.6% | 7.7% | 0.34 | 0.680 | −27.1% | 2.71 |
Selected figures summarize price-based active value, incremental macro evidence, and timing robustness.
Price Signals Generate Benchmark-Relative Active Value
Relative to the same-universe EW11 benchmark, the price-only ML portfolio records an information ratio of 0.71 and 5.0% annualized active return. The exhibit also places that result beside standard momentum variants under the same benchmark-relative lens.
Open full-size figure ↗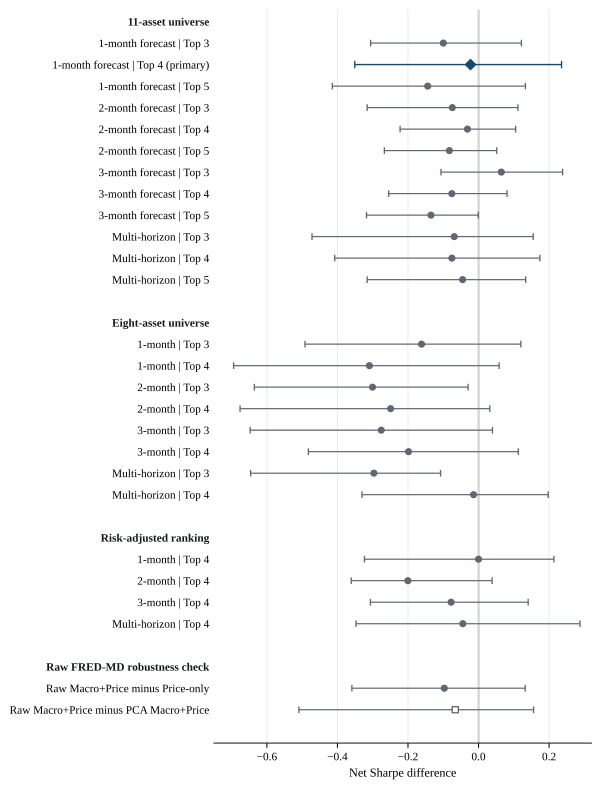
The Incremental Macro Contribution Is Not Robustly Positive
The matched Macro+Price versus Price-only comparisons do not show a stable positive Sharpe increment across the main robustness checks. The exhibit focuses on the incremental contribution of macro information rather than on standalone portfolio returns.
Open full-size figure ↗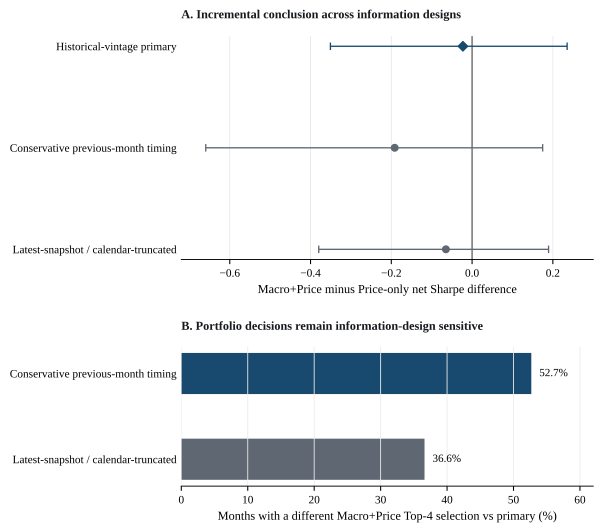
Timing Changes Portfolio Choices Without Reversing the Result
Under the conservative prior-month macro information clock, the Macro+Price minus Price-only Sharpe difference is −0.192 with a 95% moving-block bootstrap interval of [−0.659, 0.175]. The Macro+Price Top-4 selection changes in 52.7% of months relative to the primary timing design.
Open full-size figure ↗Research Design
The public replication package documents the paper-level evidence for the matched price and macro comparison. The primary analysis covers monthly out-of-sample allocation decisions from March 2017 through June 2026 across an 11-ETF U.S.-listed multi-asset universe.
Information Timing
A monthly FRED-MD vintage label is not treated as proof of exact within-month availability. The paper therefore includes a prespecified conservative timing check using the prior monthly vintage and an older macro reference month, while keeping the market-price information clock separate. The incremental-macro conclusion is unchanged under that convention.
Methods used in this research
These companion articles explain methods used directly in the study or needed to interpret its design and evidence.
Out-of-Sample Forecast Evaluation
Explains the information boundary behind the paper's repeated pseudo-out-of-sample evaluation.
Rolling vs Expanding Windows
Clarifies the fixed-length rolling estimation window used in the paper and the trade-off that window choice creates.
Look-Ahead Bias and Data Leakage
Explains how timing, data construction, and model-development choices can let future information enter a historical forecasting exercise.
Block Bootstrap
Explains dependence-aware resampling for time-series inference when IID resampling would break serial structure.
Portfolio Backtesting and Rebalancing
Explains the portfolio accounting, weight drift, monthly rebalancing, turnover conventions, and next-period timing needed to interpret the portfolio paths used in this research.
Turnover, Transaction Costs, and Net Performance
Explains drift-aware turnover, transaction-cost conventions, and the mapping from before-cost portfolio performance to performance net of modeled transaction costs.
Benchmark-Relative Portfolio Evaluation
Explains active return, tracking error, information ratio, relative wealth, and benchmark-relative drawdown as distinct portfolio-evaluation quantities.
Information Timing, Data Vintages, and Real-Time Macro Data
Explains why reference periods, release dates, vintage labels, actual availability, revisions, and forecast cutoffs must be kept distinct in macroeconomic research.
Regularized Linear Models: Ridge, Lasso, and Elastic Net
Explains Ridge, Lasso, and Elastic Net with explicit scaling, penalty, correlated-predictor, and leakage-aware tuning conventions for predictive modeling.
Time-Series Model Selection and Hyperparameter Tuning
Explains chronological model selection and hyperparameter tuning for time-ordered data, including nested evaluation, gap design, target maturity, and leakage control.
Reproducibility
Public code, the tagged replication release, and the archived Zenodo record provide the reproducibility trail for the published analysis.
Replication Repository
Paper-level code, derived evidence, and reproducibility checks.
Open GitHub ↗Zenodo DOI
Persistent archive for the public replication release.
10.5281/zenodo.22069742 ↗