Overview
A defensive strategy can meet its downside objective and still spend years lagging equity. The analysis evaluates those two outcomes separately rather than treating benchmark outperformance as evidence that downside protection succeeded.
The long-history analysis compares equity buy-and-hold, a monthly rebalanced 50/50 equity-cash allocation, and a fixed 12-month defensive trend rule. Rolling 5-, 10-, 15-, and 20-year holding periods are used to study both drawdown protection in the strategy's own wealth path and the benchmark-relative path experienced while obtaining it.
Research Question
When a defensive strategy actually reduces maximum drawdown, what benchmark-relative path accompanies that protection, and how does persistent equity exposure change that path?
Key Findings
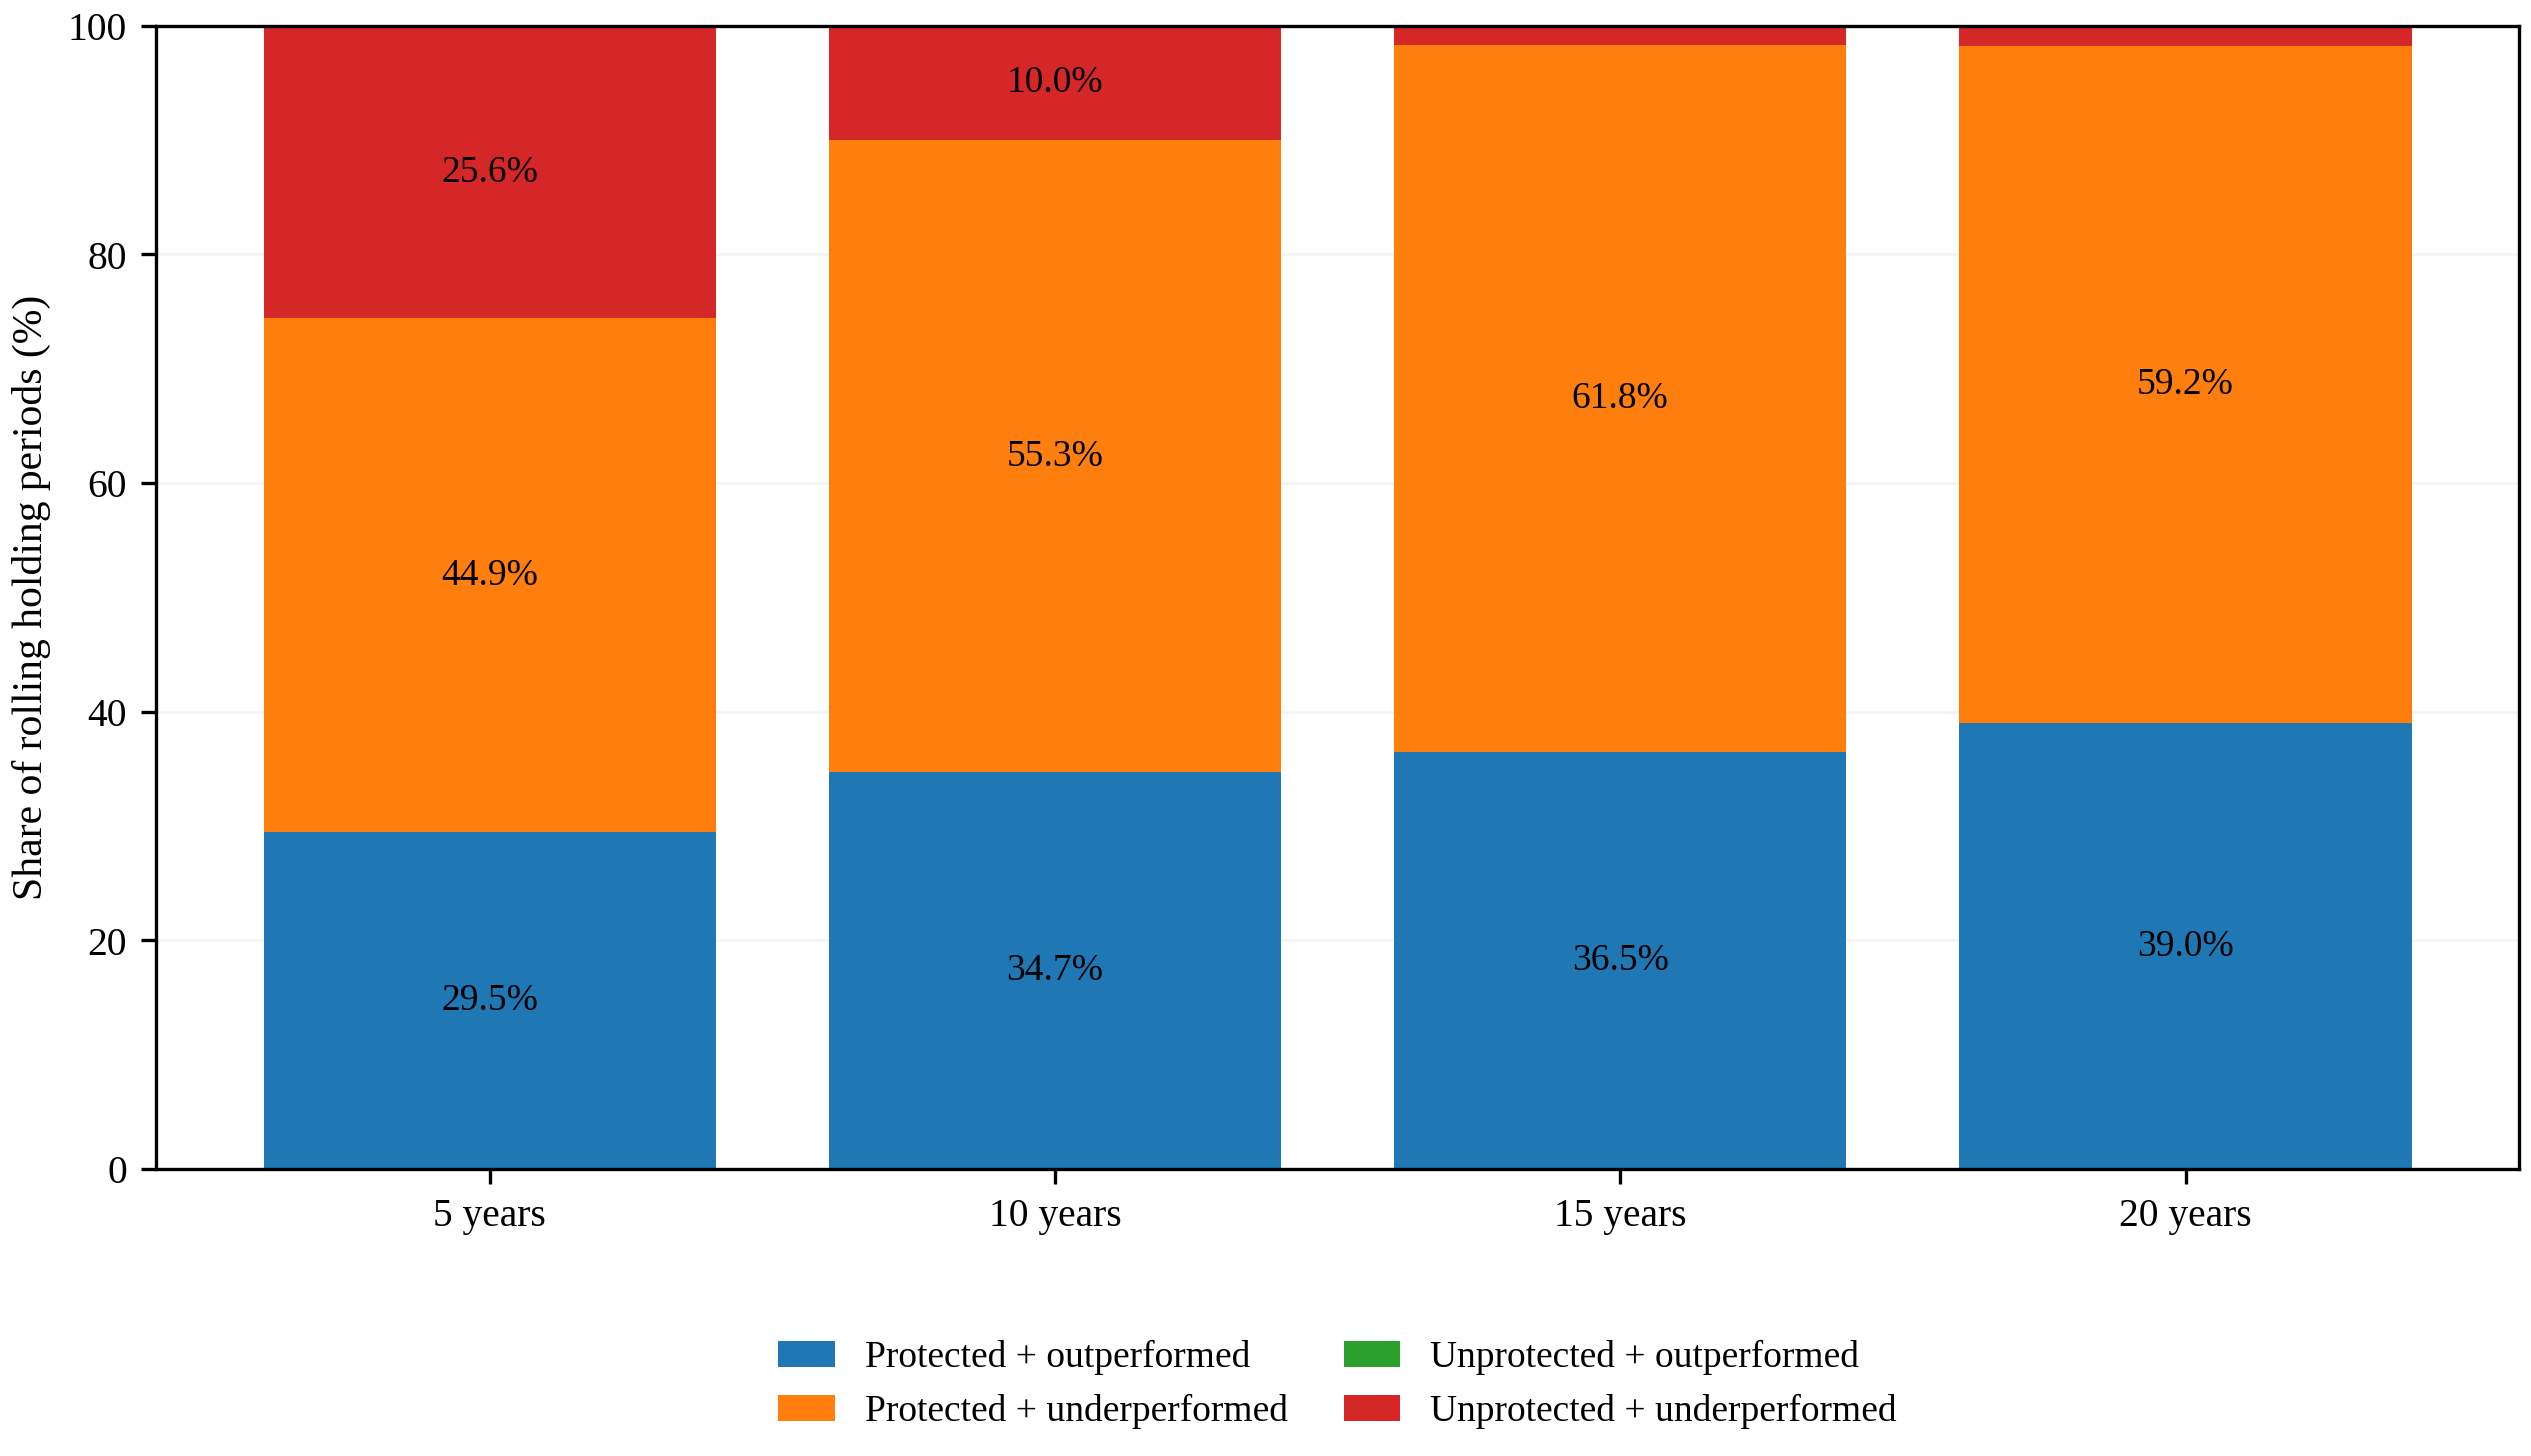
At the 20-year horizon, the 12-month defensive trend rule reduces maximum drawdown in 98.2% of rolling periods. Among those protected periods, 60.3% still finish with less terminal wealth than equity buy-and-hold.
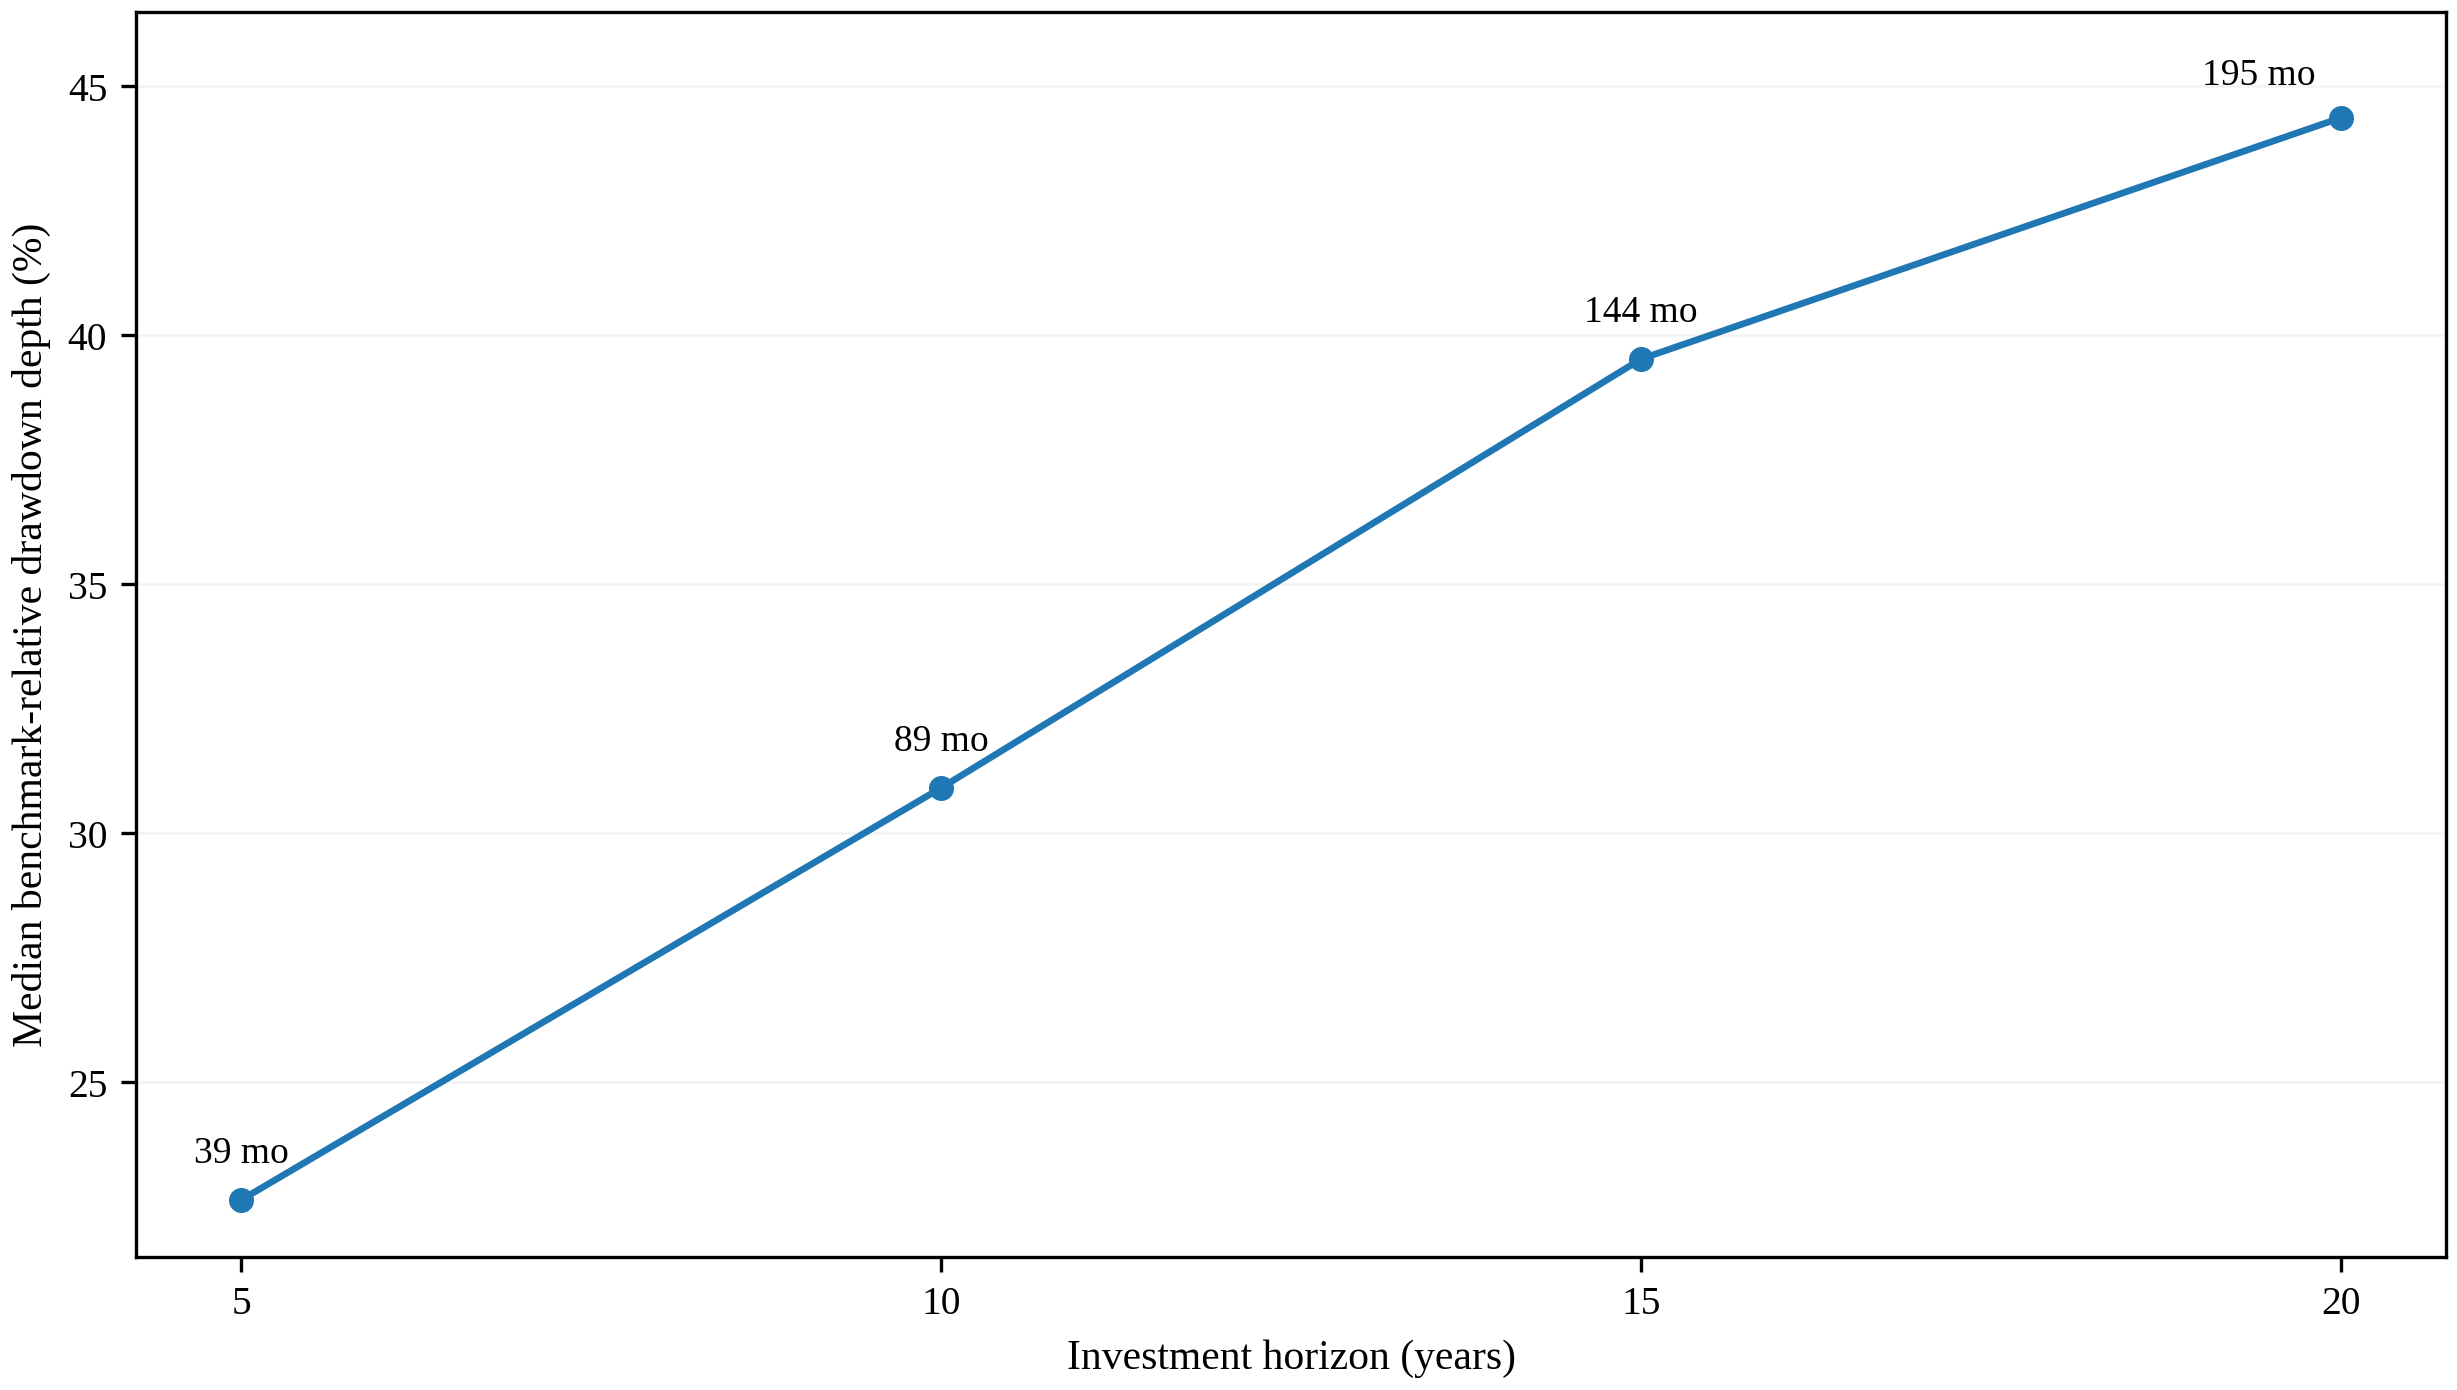
Among protected 20-year periods, the median benchmark-relative drawdown depth is 44.4%, while the median longest benchmark-relative underwater period lasts 195 months.
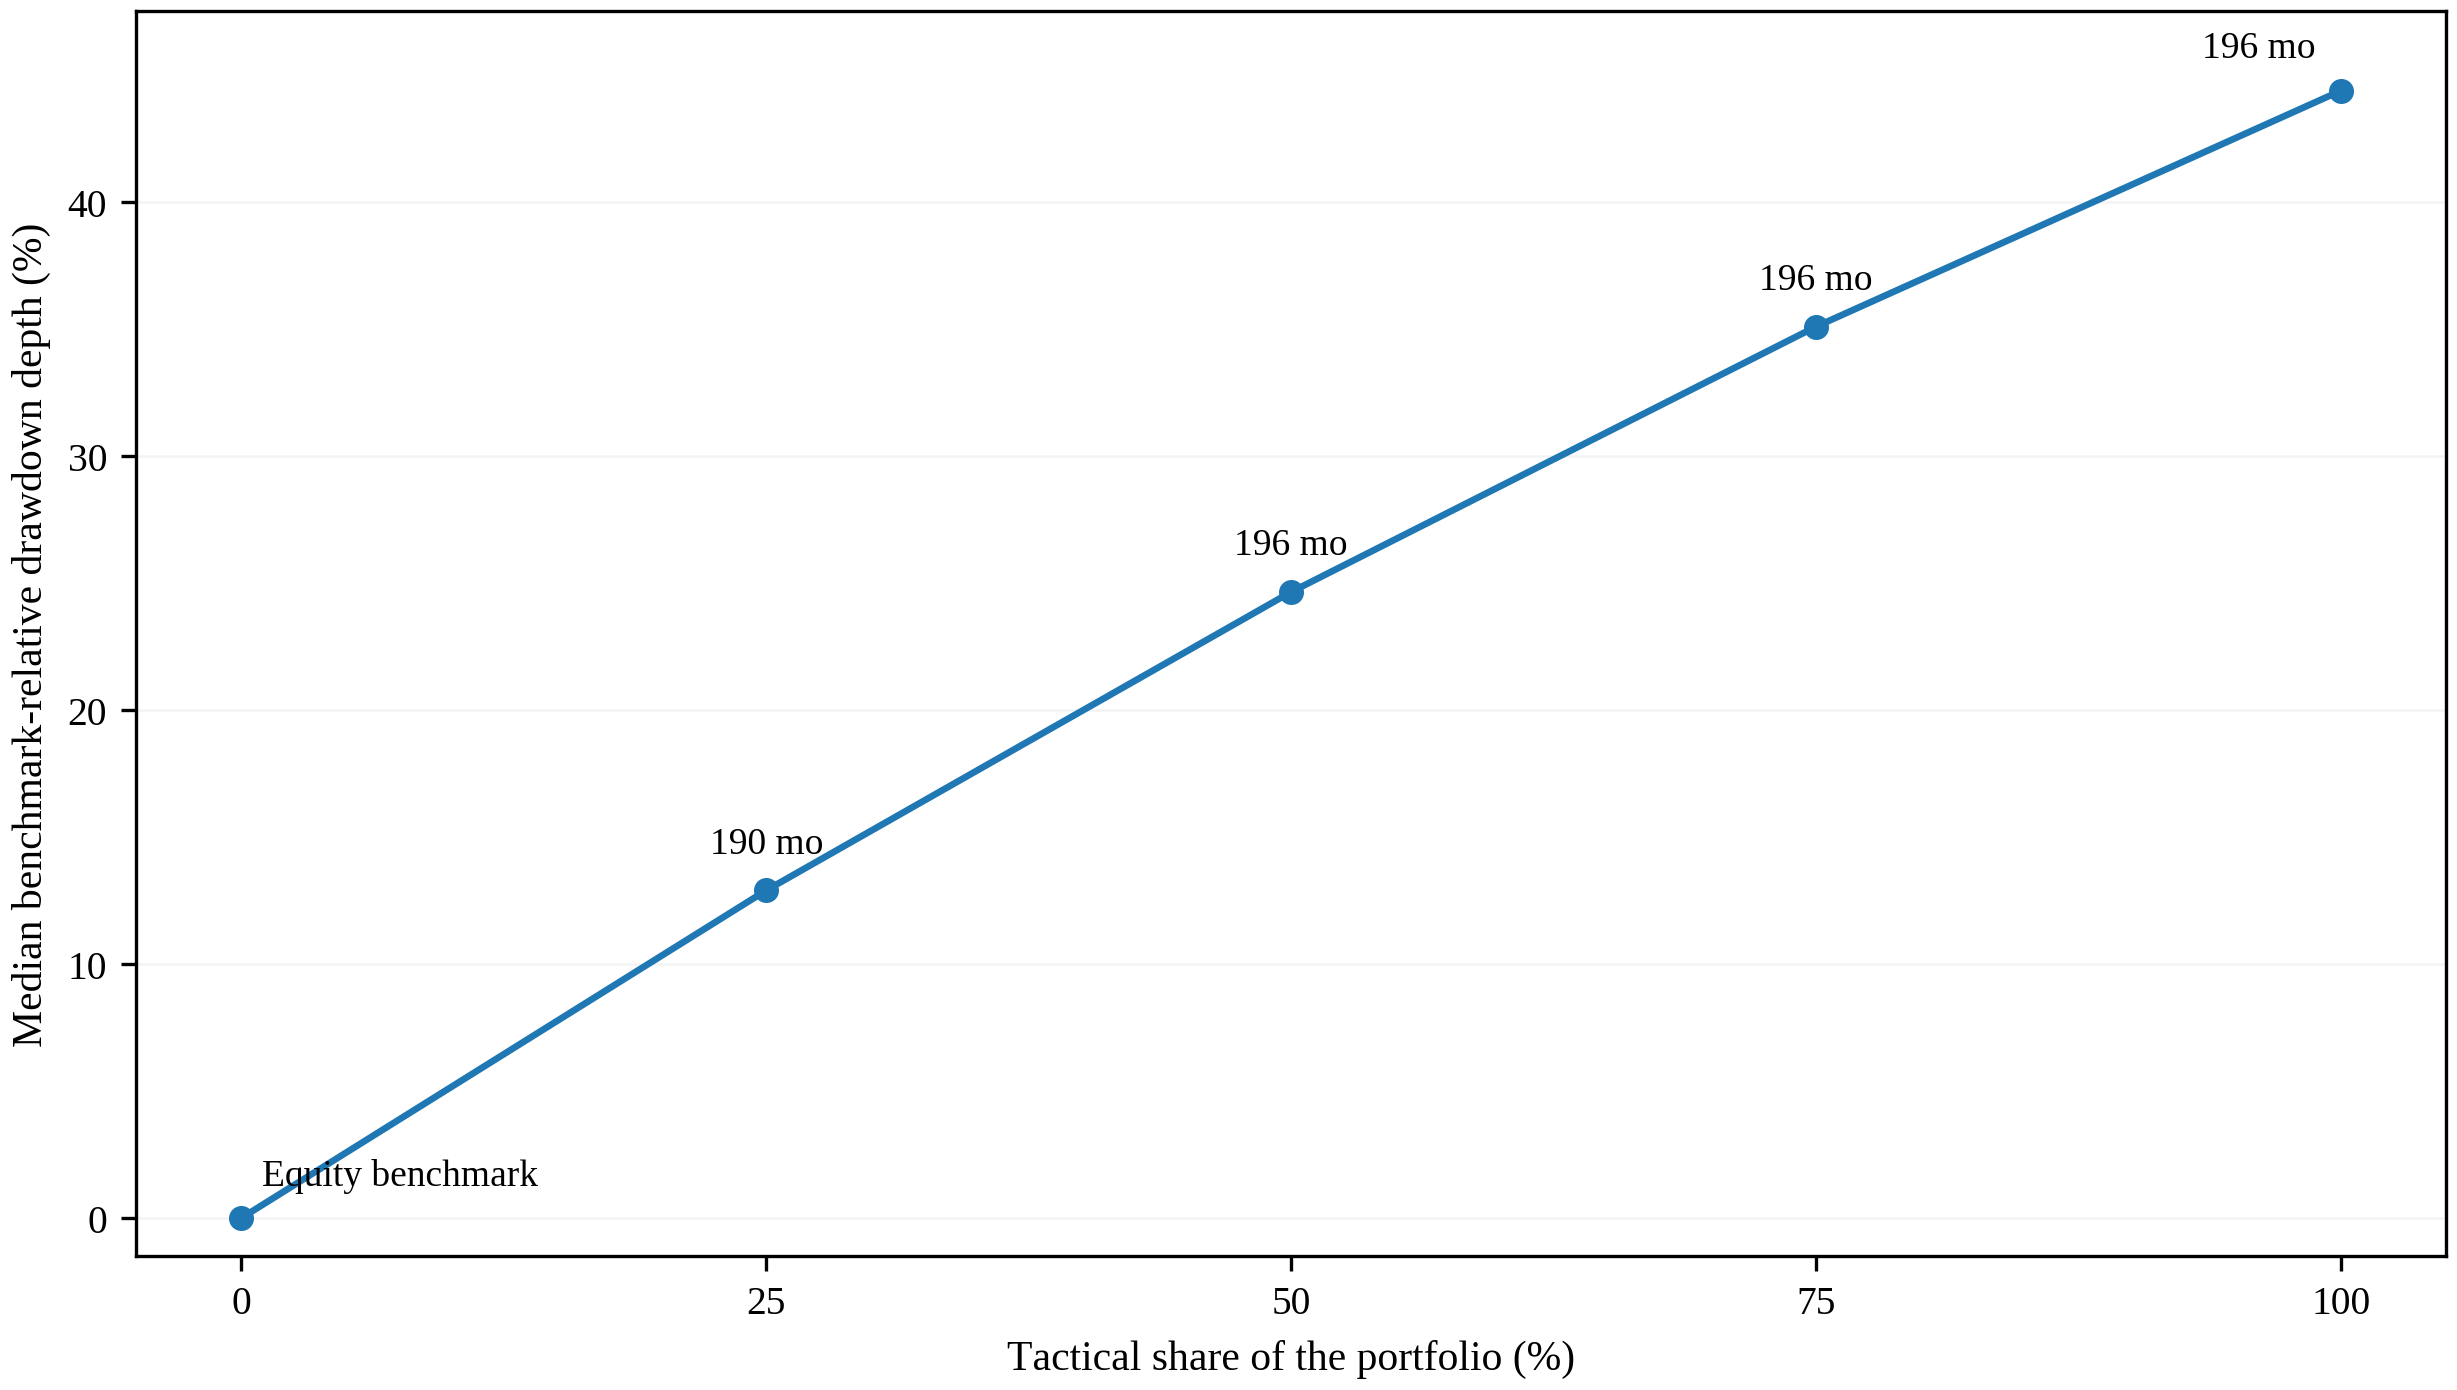
Greater persistent equity exposure is associated with substantially shallower benchmark-relative drawdowns, while the longest underwater duration changes much less across the fixed blends.
The qualitative pattern remains visible in an independent Shiller/FRED reconstruction and under fixed trading-cost assumptions, although the magnitudes differ.
Selected Evidence
Four statistics summarize the central 20-year results in the July 1927–June 2026 Kenneth R. French Data Library sample.
98.2%
20-year periods in which the trend rule reduces maximum drawdown vs. equity
60.3%
Protected 20-year periods ending below equity
44.4%
Median benchmark-relative drawdown depth among protected 20-year periods
195 mo
Median longest benchmark-relative underwater spell among protected 20-year periods
Drawdown protection and benchmark-relative performance answer different questions. Relative drawdown depth is not a portfolio loss; it is a decline from a prior high-water mark in the strategy-to-equity wealth ratio.
Selected Exhibits
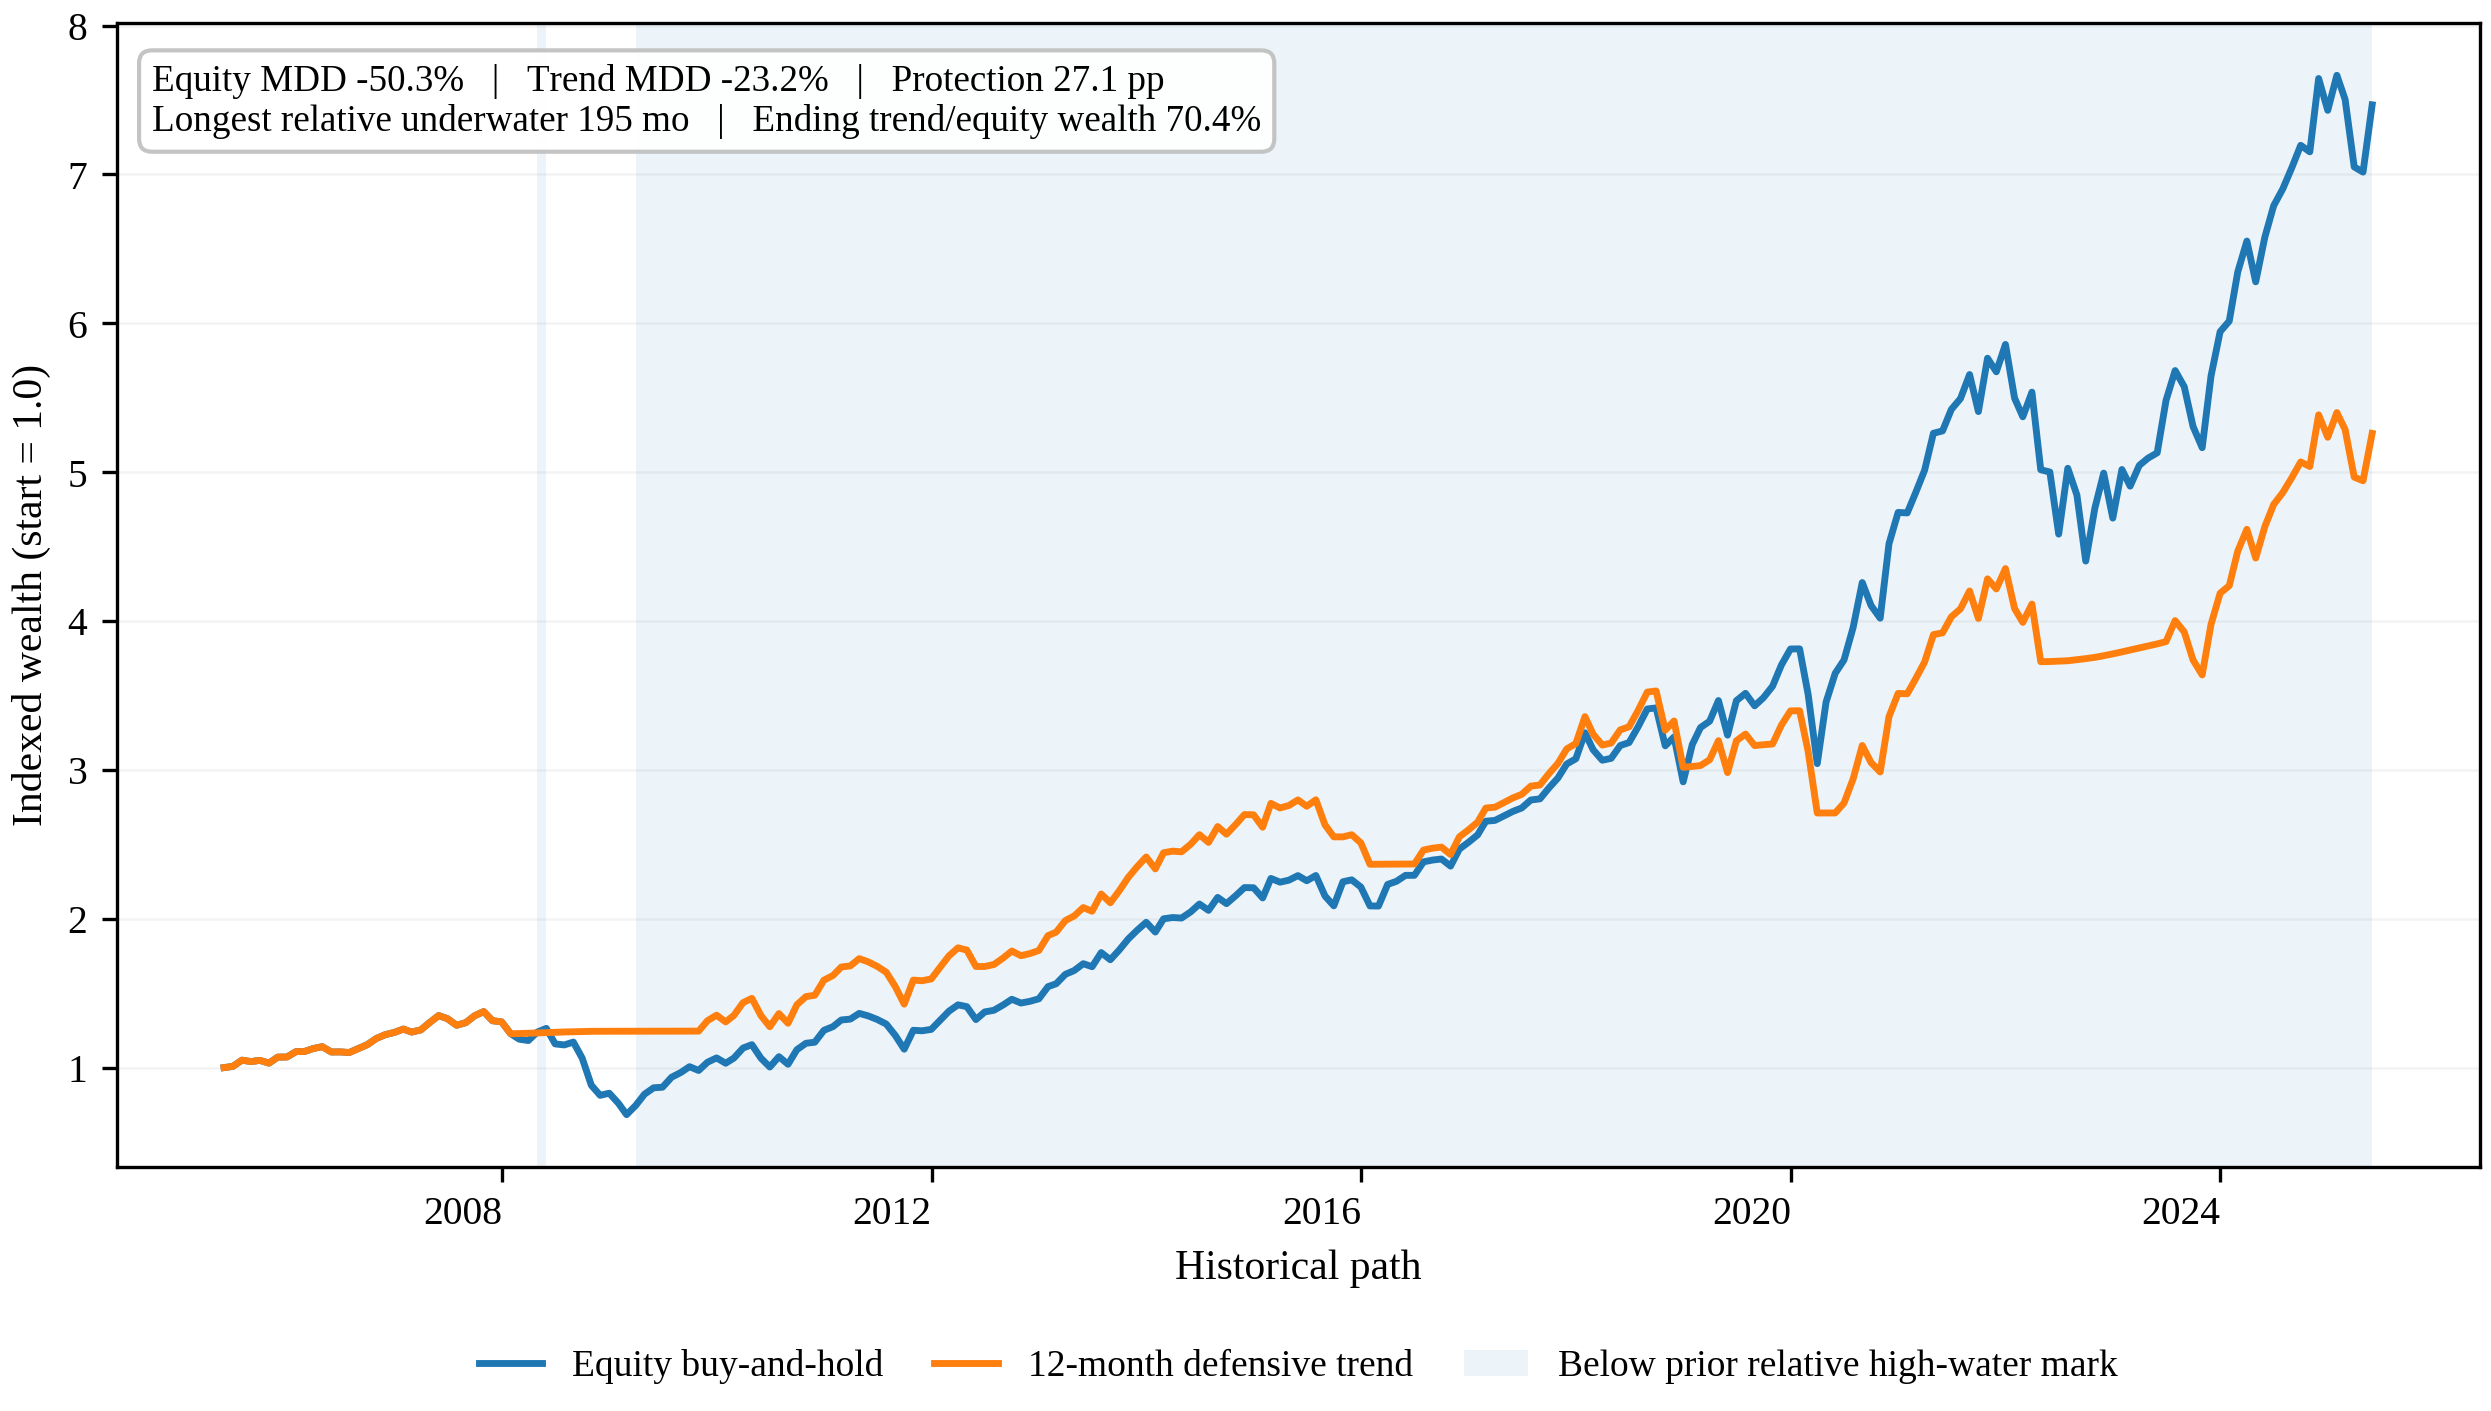
Four selected working-paper figures summarize downside protection, the benchmark-relative path, an illustrative 20-year episode, and the role of persistent equity exposure. Click any figure to inspect the full-resolution public image.
Timing Asymmetry
Protection can arrive in concentrated stress episodes while benchmark-relative opportunity cost accumulates across much longer intervals.
Illustrative 20-year path
27.1 pp
June 2005–May 2025: the trend rule reduces maximum drawdown by 27.1 percentage points, yet ends at 70.4% of equity's terminal wealth and spends 195 months below a prior benchmark-relative high-water mark.
Concentrated defensive gains
36.2%
The 20 largest months of qualifying defensive outperformance account for 36.2% of total positive monthly active log returns after the signal becomes available; the fixed 50/50 allocation accounts for 19.6%.
The trend rule records 112 qualifying months under the paper's fixed criterion, with a median gap of two months. These counts are descriptive because adjacent crisis months can belong to the same market episode.
Evaluation Design
01 · PROTECTION
Own-path drawdown
Measure whether the defensive allocation reduces maximum drawdown relative to equity within the same holding period.
02 · ENDPOINT
Terminal benchmark outcome
Record whether terminal wealth finishes above or below equity buy-and-hold.
03 · PATH
Relative depth and duration
Measure benchmark-relative drawdown depth and the longest spell below a prior relative high-water mark separately.
Portfolio Design
Persistent equity exposure changes the severity of the benchmark-relative shortfall more than its duration.
Pure tactical
44.4%
Median benchmark-relative drawdown depth across all 20-year periods. The corresponding median longest underwater spell is 196 months.
25% tactical / 75% equity
12.9%
Median relative drawdown depth across all 20-year periods, while the median longest underwater duration remains about 190 months.
The fixed blends are descriptive portfolio-design comparisons, not estimated optimal allocations. Their role is to show how benchmark-relative depth and duration move as persistent equity exposure increases.
Robustness
Independent reconstruction
Shiller / FRED
The qualitative depth-versus-duration pattern remains visible in an independently reconstructed historical series over the matched February 1935–June 2023 sample, although the magnitudes differ from the Kenneth R. French Data Library results.
Trading costs
0–50 bps one-way
Fixed turnover costs worsen benchmark-relative performance but do not remove the coexistence of realized downside protection and prolonged relative shortfall.
Scope & Interpretation
U.S. historical evidenceThe long-history results describe U.S. return paths and do not establish that the same magnitudes hold across other markets, asset classes, or future regimes.
Overlapping holding periodsRolling periods overlap and are strongly dependent. Reported frequencies summarize the historical sample; they are not probabilities estimated from independent trials.
Investor tolerance is not estimatedReturn histories do not identify an investor's actual abandonment threshold. Benchmark-relative tolerance remains an implementation constraint rather than an estimated behavioral parameter.
Empirical, not optimization, evidenceThe timing rule and blend weights are fixed design choices. The analysis characterizes historical trade-offs rather than estimating an optimal tactical allocation.
Quantitative Methods
Methods used in this research
These companion articles explain methods used directly in the study or needed to interpret its design and evidence.
QM007 · Portfolio Methods · Foundation
Portfolio Backtesting and Rebalancing
Explains the portfolio accounting, weight drift, monthly rebalancing, turnover conventions, and next-period timing needed to interpret the portfolio paths used in this research.
QM008 · Portfolio Methods · Foundation
Drawdown, Underwater Duration, and Recovery
Explains drawdown, high-water-mark, underwater-duration, recovery, and censoring conventions used to interpret path-dependent downside and recovery in this research.
QM009 · Portfolio Methods · Intermediate
Turnover, Transaction Costs, and Net Performance
Explains drift-aware turnover, transaction-cost conventions, and the mapping from before-cost portfolio performance to performance net of modeled transaction costs.
QM010 · Portfolio Methods · Intermediate
Momentum and Trend Signals
Explains how momentum and trend signals are defined, timed, and stress-tested across lookback choices before they are translated into portfolio decisions.
QM012 · Portfolio Methods · Intermediate
Rolling Holding-Period Analysis
Explains rolling long-horizon outcome analysis, overlapping-window dependence, and the distinction between endpoint outcomes and the path experienced while reaching them.
QM013 · Portfolio Methods · Intermediate
Benchmark-Relative Portfolio Evaluation
Explains active return, tracking error, information ratio, relative wealth, and benchmark-relative drawdown as distinct portfolio-evaluation quantities.
Reproducibility
The public replication repository reproduces the long-history analysis, fixed blends, trading-cost sensitivity, independent reconstruction, and all five working-paper figures. Raw third-party source files are not redistributed.
Public code
Replication Repository
Python pipeline, tests, reference hashes, generated results, and manuscript figures.
Open GitHub ↗Replication
Replication Package
Latest tagged public package: v1.1.1. The repository is synchronized to the final public SSRN paper.
Open release ↗Archival record
Release / DOI
Archived public replication release with persistent DOI.
Open DOI ↗Citation
Lee, S. (2026). When Protection Works but the Portfolio Still Lags: Long-Horizon Evidence on Downside Protection, Benchmark-Relative Drawdowns, and Persistent Equity Exposure. Public Working Paper. SSRN 7291898.