Overview
The Multi-Asset Scenario Stress Lab is a human-in-the-loop system for exploring how portfolios behave under plausible joint market stress. It generates conditional multi-asset return paths, organizes adverse scenarios into interpretable stress archetypes, and revalues portfolios on a common scenario set. A transparent historical resampling benchmark remains visible throughout the analysis.
Current Scope
The current public baseline is Stress Lab Universe v1. Its eight ETFs areSPY · EFA · EEM · IEF · LQD · GLD · DBC · VNQ. The dashboard provides four views: Stress Lab, Portfolio What-if, Stress Dependence, and Scenario Distribution.
v1 · validated 8-ETF universe
Eight-ETF baseline tied to the existing Stage-D evidence, Technical White Paper, and current public dashboard.
Same-scenario comparison
Baseline and candidate portfolios are revalued on the same scenario cloud so allocation effects can be interpreted separately from scenario-generation effects.
Stress exploration
The system asks how a portfolio can break under plausible joint stress structures, rather than predicting which event will happen next.
What the Evidence Supports
The primary out-of-sample evaluation used 348 fixed forecast origins from 2019 through 2025. B1 EWMA-t remained the reference model. Flow F1 remained competitive and faster than the higher-step Flow reference, but the evidence did not establish predictive superiority for a modern generative model over B1.
How the System Works
B1 EWMA-t
Uses eligible history through the forecast origin to estimate a mean and exponentially weighted covariance matrix, then generates heavy-tailed multivariate Student-t innovations.
B0 block bootstrap
Resamples contiguous 20-day historical blocks without conditioning on the current state. It remains visible as the transparent reference.
Flow F1
Kept as a research comparator only. Public warnings, model switching, blending, and confidence signals do not depend on Flow.
Current Conditional Stress Snapshot
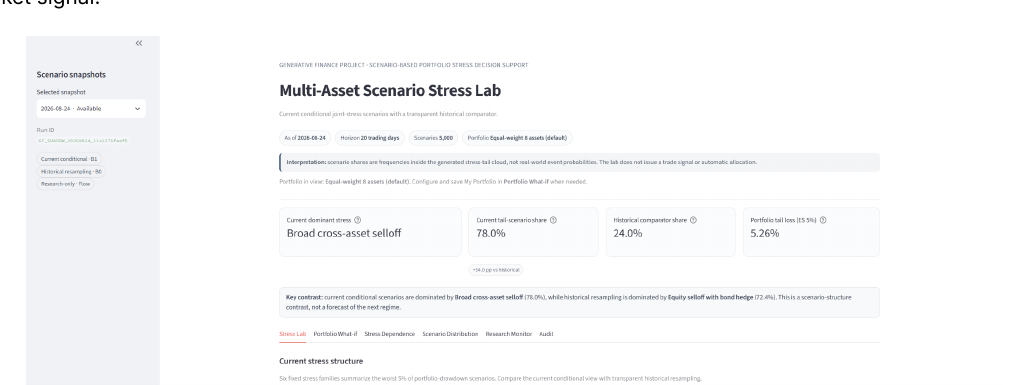
This is the current reviewed Stress Lab snapshot, not a frozen paper exhibit. The conditional B1 scenario structure is shown directly against the B0 historical resampling comparator using the same public operating authority as the dashboard.
| Stress family | Current B1 | Historical B0 | Gap |
|---|---|---|---|
| Broad cross-asset selloff | 80.0% | 28.0% | +52.0pp |
| Credit / REIT-led stress | 0.0% | 5.2% | -5.2pp |
| Commodity-up / duration-down | 5.6% | 0.0% | +5.6pp |
| Equity-bond joint selloff | 1.6% | 0.0% | +1.6pp |
| Equity selloff with bond hedge | 12.8% | 66.8% | -54.0pp |
| Other tail | 0.0% | 0.0% | +0.0pp |
2.02%
Generated scenarios with equal-weight portfolio return at or below −5%.
3.90%
Historical-resampling scenarios with equal-weight portfolio return at or below −5%.
Equal-weight 8 assets
Distribution metrics use the same transparent reference portfolio for B1 and B0.
Published Stage-D evidence remains citable and unchanged
Stage D tests whether the adverse scenario set contains a stable and externally relevant representation of the joint stress pattern that subsequently occurred. Across 56 fixed large-drawdown origins, B1 placed more tail mass on the realized archetype and produced closer representative stress geometry than B0.
| Method | D1 share | D2 top-2 | D3 distance | Stability TVD | Status |
|---|---|---|---|---|---|
| B0 block bootstrap | 0.3661 | 0.9821 | 2.9171 | 0.0537 | Comparator |
| B1 EWMA-t | 0.6106 | 0.9821 | 1.8847 | 0.0468 | PASS |
| Flow F1 | 0.3420 | 0.9821 | 1.9148 | 0.0498 | Does not qualify |
Operating Model
Interpretation Boundaries
- Stress-family shares within the modeled B1 tail
- B1 conditional stress structure vs B0 historical resampling
- Representative joint stress paths and geometry
- Model-implied tail/path diagnostics and dependence structure
- Human portfolio what-if comparisons on a fixed scenario cloud
- Calibrated crisis or archetype probabilities
- Market timing or crash prediction
- Causal tail-driver attribution from archetype labels
- Automated BIL de-risking or optimized portfolio weights
- Model-switching, blending, or predictive confidence traffic lights
Methods used in this system
These companion articles explain methods used directly in the system or needed to interpret its validation and outputs.
Out-of-Sample Forecast Evaluation
Defines the out-of-sample information boundary used when the Stress Lab evaluates scenario-generation methods without leaking future market information.
Look-Ahead Bias and Data Leakage
Defines leakage controls for dated market inputs, scenario construction, retrospective evaluation, and public evidence used by the Stress Lab.
Block Bootstrap
Explains dependence-aware block resampling used by the Stress Lab's transparent historical comparator.
Multivariate Probabilistic Forecast Evaluation
Provides multivariate probabilistic evaluation concepts used to assess joint scenario quality beyond a single marginal accuracy score.
EWMA-t Scenario Simulation
Defines the EWMA-t conditional scenario engine used as the Stress Lab's reference model for heavy-tailed joint return simulation.
Scenario-Based Portfolio Stress Testing
Defines same-scenario portfolio stress testing, tail-loss measurement, and what-if comparison without turning the exercise into portfolio optimization.
Stress Archetypes and Representative Scenario Geometry
Defines stress-archetype construction and representative-scenario geometry used to summarize adverse scenario structure in interpretable form.
Documentation & Access
The Korean Full Manual v1.2 is the comprehensive operating and explanatory guide. The Technical White Paper is the research and validation artifact. Dashboard-specific interpretation is kept within the dashboard and the Full Manual rather than maintained as a separate public guide layer.
Deployment code is maintained separately from the research project. The public dashboard does not expose licensed data, locally saved portfolios, research checkpoints, or internal audit records.