A Second Opinion for the Portfolio
Overview
Forecasting models are usually compared by prediction error. A portfolio, however, holds positions rather than forecasts. This study asks whether a new model can improve a cross-asset allocation process even when it does not win the average point-forecast error contest.
Chronos-2 is introduced into a matched Forecast-to-Rank Allocation (F2R) research design. The asset universe, Top-4 portfolio rule, execution clock, transaction-cost treatment, and portfolio accounting remain fixed while model composition and the forecast-integration interface are examined. The emphasis is on changed portfolio decisions and their consequences, not forecasting accuracy in isolation.
Research Question
Key Findings
Decision Evidence
The central result is not that Chronos-2 forecasts better on average. It does not. The portfolio evidence instead shows that a different model can change the cross-sectional ordering at decision boundaries in ways that matter for the realized allocation path.
Net historical portfolio evidence under the common F2R portfolio, execution, and cost framework.
| Configuration | CAGR | Sharpe | Interpretation |
|---|---|---|---|
| Incumbent four-model ensemble | 14.92% | 0.891 | Conventional reference |
| Chronos-2 standalone | 15.49% | 0.962 | Different forecast model, same portfolio interface |
| Three-model + Chronos-2 hybrid | 17.13% | 0.987 | Selected historical research configuration |
Three paper-aligned figures summarize the forecasting-versus-portfolio distinction, the ensemble ablation, and the changed decisions that account for the relative wealth gap. Click any figure to inspect the full-resolution publication-aligned image.
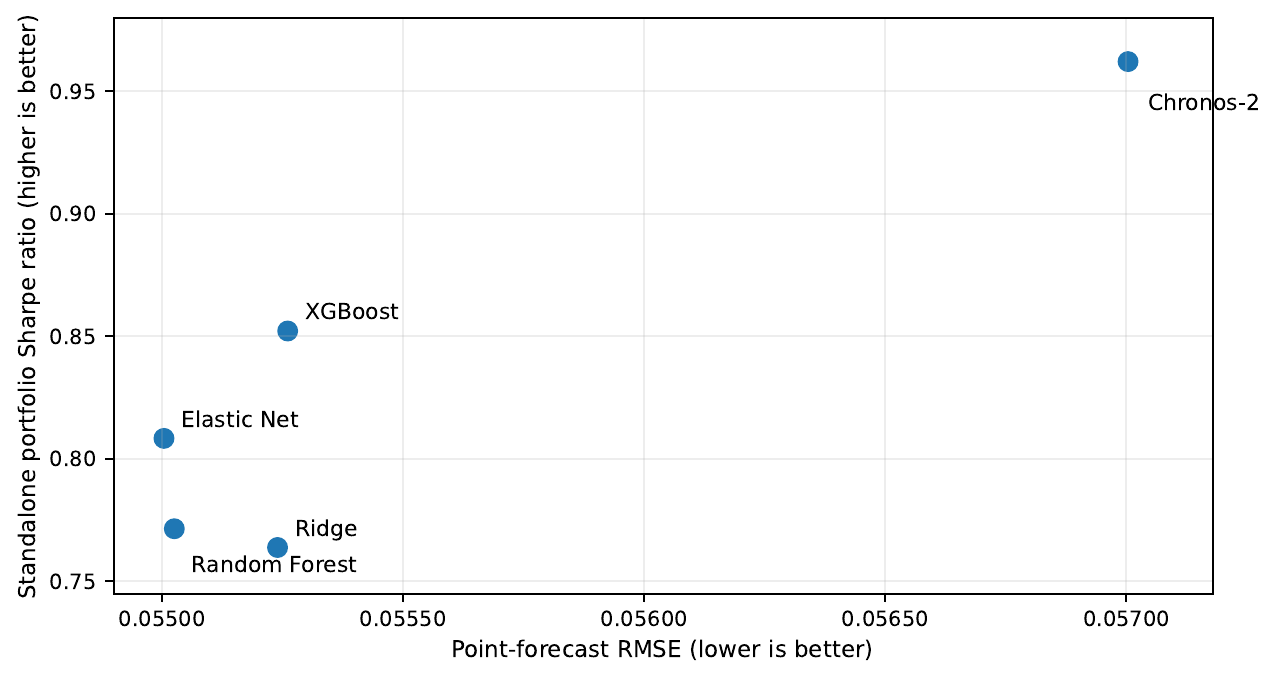
Forecast Accuracy and Portfolio Value Can Disagree
Chronos-2 has worse point-forecast RMSE than the conventional models, yet its standalone Top-4 portfolio records the strongest Sharpe ratio among the standalone models. The exhibit motivates evaluating model adoption at the decision layer rather than by forecast error alone.
Open full-size figure ↗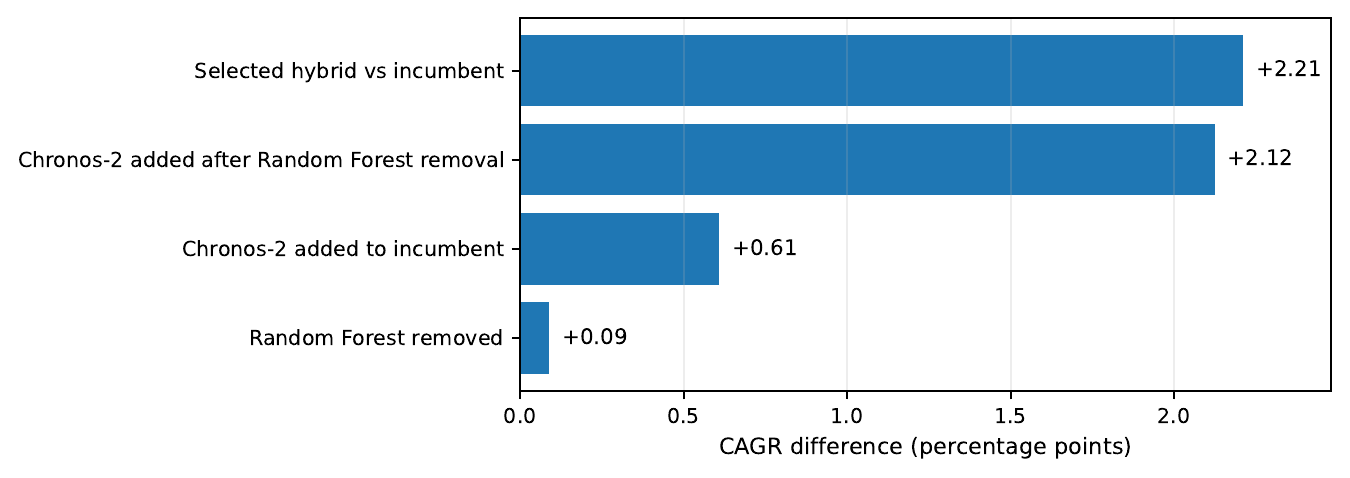
Chronos-2 Value Depends on Ensemble Context
Removing Random Forest by itself adds only 0.09 percentage points of CAGR. Adding a 20% Chronos-2 model-combination contribution to the incumbent adds 0.61 points, while adding it after Random Forest removal adds 2.12 points; the selected hybrid is 2.21 points above the incumbent. These are descriptive historical contrasts, not causal estimates.
Open full-size figure ↗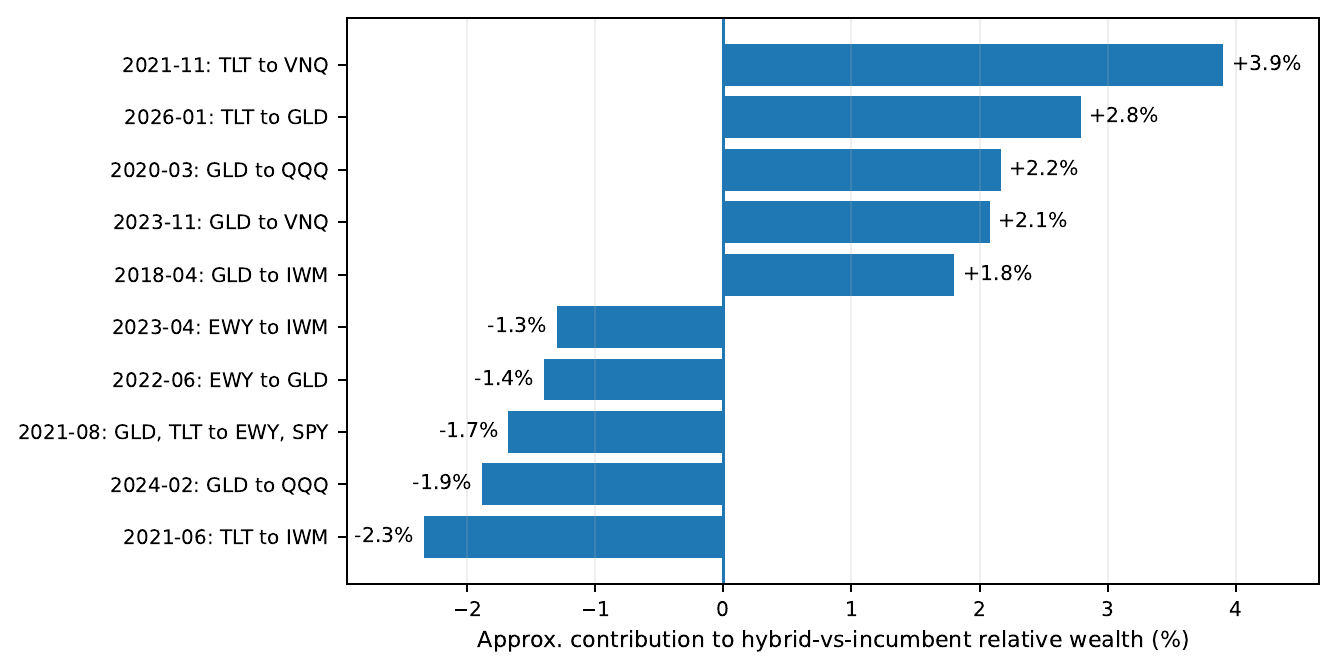
Boundary Decisions Explain Where the Portfolio Paths Diverge
The largest positive and negative changed-decision months show how Top-4 substitutions transmit into the hybrid-versus-incumbent relative wealth path. The attribution is an accounting diagnostic of where divergence enters, not an independent causal estimate of model value.
Open full-size figure ↗Research Design
The exercise uses 112 monthly historical signal dates from March 2017 through June 2026 across 11 U.S.-listed ETFs. Forecasts are translated into relative ranks, the Top-4 are selected, and each selected asset receives a 25% target weight in the historical research portfolio. The reported performance path begins May 1, 2017 and extends through August 3, 2026 to complete the final holding interval.
For the matched rank-versus-standardized comparison, the frozen forecasts, three conventional models, Chronos-2 contribution, 80/20 model-combination weights, Top-4 rule, execution clock, and transaction costs are held fixed. Only the forecast-integration interface changes.
Interpretation Boundary
This is a retrospective technology counterfactual, not a 2017–2026 real-time track record. Chronos-2 did not exist throughout the evaluation period, its pretraining corpus is not audited here for temporal overlap, and the main hybrid was developed within the same historical research program rather than on an untouched holdout.
The conventional models and Chronos-2 use the same F2R-side price-data domain available at each historical signal date and the same portfolio implementation framework, but they are not informationally identical: Chronos-2 brings prior information from pretraining. The empirical contrasts should be read as model-adoption evidence under a controlled portfolio interface, not as a causal estimate or a claim of historical live deployment.
Methods used in this research
These companion articles explain methods used directly in the study or needed to interpret its design and evidence.
Out-of-Sample Forecast Evaluation
Explains the information boundary behind the paper's repeated pseudo-out-of-sample evaluation.
Look-Ahead Bias and Data Leakage
Explains how timing, data construction, and model-development choices can let future information enter a historical forecasting exercise.
Portfolio Backtesting and Rebalancing
Explains the portfolio accounting, weight drift, monthly rebalancing, turnover conventions, and next-period timing needed to interpret the portfolio paths used in this research.
Turnover, Transaction Costs, and Net Performance
Explains drift-aware turnover, transaction-cost conventions, and the mapping from before-cost portfolio performance to performance net of modeled transaction costs.
Strategy Similarity and Decision Diversification
Explains how return similarity differs from similarity in what strategies hold, when they change, and how strongly they change risk exposure.
Regularized Linear Models: Ridge, Lasso, and Elastic Net
Explains Ridge, Lasso, and Elastic Net with explicit scaling, penalty, correlated-predictor, and leakage-aware tuning conventions for predictive modeling.
Time-Series Model Selection and Hyperparameter Tuning
Explains chronological model selection and hyperparameter tuning for time-ordered data, including nested evaluation, gap design, target maturity, and leakage control.
Cross-Sectional Ranking, Top-K Selection, and Hold Buffers
Explains the translation from cross-sectional scores to ranks and portfolio selections, including normalized rank strength, Top-K entry, incumbent hold buffers, turnover trade-offs, and path dependence.
Forecast Combination and Model Averaging
Explains forecast combination and model averaging, including weighting uncertainty, scale compatibility, rank aggregation, and leakage-aware ensemble evaluation.
Pretrained Time-Series Foundation Models
Explains pretrained time-series forecasting models by separating inference-time data, pretraining knowledge, zero-shot use, covariate timing, and fair historical evaluation claims.
Reproducibility
The public replication package starts from frozen derived research evidence. It reproduces the paper-level figures and principal numerical checks without rerunning Chronos-2 inference, refitting the conventional forecasting models from raw market data, or exposing live F2R production configuration.
Replication Repository
Paper-level code, frozen derived evidence, and validation checks.
Open GitHub ↗GitHub Release v1.1
Versioned public release bound to the archived replication record.
Open release ↗Replication DOI
Immutable Zenodo archive for the public replication release.
10.5281/zenodo.22750810 ↗Research Lineage
This paper follows an earlier F2R study that asks a different question: whether historical-vintage macro information adds decision value beyond price information. The present study fixes the portfolio-side price information domain and moves the research question to model adoption and forecast integration.